Early Data Assessment Dashboard
Use the EDA Dashboard to apply filters to cull the data set and generate a breakdown of data for analysis and review. The EDA Dashboard is inactive until you process any data. To view the EDA Dashboard, refer to View EDA Dashboard.
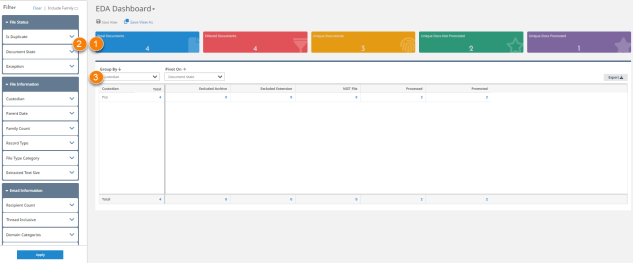
The following figure shows an example EDA Dashboard.
-
Summary cards. Summary information at the top of the page includes the following information.
-
Total Documents. Total number of documents in the project.
-
Filtered Documents. Number of filtered documents.
-
Unique Documents. Number of unique documents within the filtered documents.
-
Unique Docs Promoted. Number of unique documents promoted within the filtered documents.
-
Unique Docs Not Promoted. Number of unique documents not promoted within the filtered documents.
Click a summary card to view the list of documents in the Inspect page. Hover over Filtered Documents or Unique Documents summary card to view the number of excluded or duplicate documents.
-
-
Filter pane. When you do not select any options on the Filter pane, the totals in the dashboard reflect all the data. You can modify the dashboard information using the File Status, File Information, and Email Information options on the Filter pane. For example, when you select the Promoted checkbox in File Status>Document State, the summary information and pivot table show totals for only promoted data. Refer to Modify the EDA Dashboard for more information.
-
Pivot table. You can view the detail information about the filtered and promoted documents in the pivot table. Click a cell in the table to view the documents in the Inspect page. When you select the Include Family check box in the Filter pane and click Apply, the document counts in the pivot table changes. However, when opening these documents in Inspect via the dashboard, the documents load without family so the total numbers differ accordingly. Refer to Modify the EDA Dashboard.